



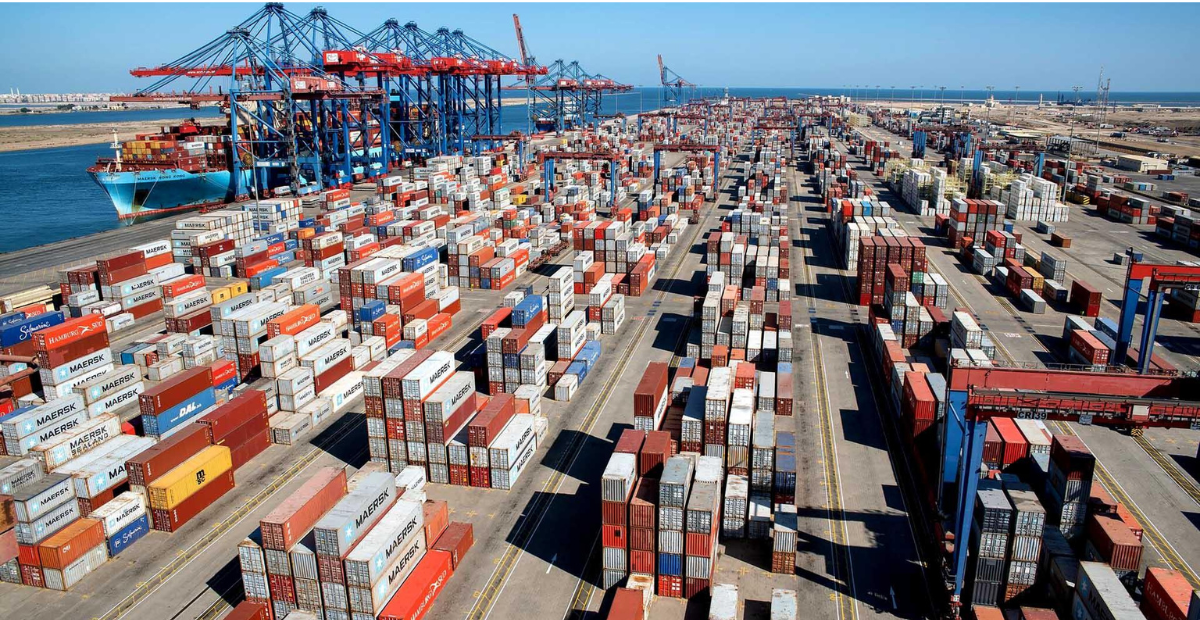
India’s total exports rose 13.16% during the first four months of 2026-27, reaching an estimated $316.42 billion, according to data released by the Ministry of Commerce and Industry.
Exports of merchandise and services stood at $279.63 billion during April-July 2025-26. The latest figures show a significant increase over the same period last year.
However, imports grew at a faster pace during the period. Total imports rose 17.28% to $365.85 billion, compared with $311.94 billion a year earlier.
This pushed India’s overall trade deficit to $49.43 billion during April-July 2026-27, compared with $32.32 billion in the corresponding period of 2025-26.
July Exports Cross $80 Billion
India’s total exports in July 2026 were estimated at $80.14 billion. This was 13.31% higher than the $70.72 billion recorded in July 2025.
Imports also increased during the month. Total imports rose 15.83% to $95.16 billion from $82.16 billion a year earlier.
The resulting trade deficit stood at $15.03 billion in July, compared with $11.43 billion in July 2025.
The July services figures are estimates. The latest services data released by the Reserve Bank of India is for June 2026.
Merchandise Exports Show Strong Growth
Merchandise exports reached $44.24 billion in July 2026, compared with $36.98 billion in July last year.
Merchandise imports also increased, rising to $76.22 billion from $64.86 billion.
For April-July 2026-27, merchandise exports stood at $173.78 billion, compared with $148.48 billion during the same period last year.
Merchandise imports increased to $292.38 billion from $245.14 billion.
As a result, the merchandise trade deficit widened to $118.60 billion during April-July 2026-27, compared with $96.66 billion in the previous year.
Engineering and Electronic Goods Lead Export Growth
Several major export categories recorded strong growth in July.
Iron ore exports recorded the highest growth among the listed categories, rising 78.35% compared with July 2025.
Petroleum products followed with growth of 67.64%, while electronic goods exports increased 57.4%.
Meat, dairy and poultry products recorded 40.84% growth. Cashew exports rose 25.11%, while marine products increased 17.83%.
Engineering goods also performed strongly, recording 17.71% growth.
Other categories that recorded positive growth included handicrafts excluding handmade carpets, organic and inorganic chemicals, plastics and linoleum, cereal preparations and miscellaneous processed items, cotton yarn and textiles, drugs and pharmaceuticals, and man-made yarn and fabrics.
Services Continue to Support Exports
India’s services exports also remained an important contributor to overall export growth.
Services exports in July 2026 were estimated at $35.89 billion, compared with $33.74 billion in July 2025.
Services imports stood at an estimated $18.94 billion, compared with $17.30 billion a year earlier.
During April-July 2026-27, services exports were estimated at $142.64 billion, up from $131.15 billion during the same period last year.
Services imports increased to $73.47 billion from $66.81 billion.
Despite the increase in imports, India recorded a services trade surplus of $69.17 billion during the four-month period. This was higher than the $64.35 billion surplus recorded in April-July 2025-26.
The government estimates that services exports grew 6.38% during April-July 2026-27 compared with the same period last year.
Non-Petroleum Exports Also Increase
Exports excluding petroleum products reached $37.32 billion in July 2026, compared with $32.86 billion in July 2025.
When both petroleum and gems and jewellery are excluded, exports stood at $35 billion, compared with $30.47 billion a year earlier.
For April-July 2026-27, non-petroleum exports reached $143.61 billion, compared with $127.32 billion during the corresponding period last year.
Non-petroleum and non-gems and jewellery exports increased to $134.02 billion from $118.27 billion.
Singapore, China and Other Markets See Growth
Several export destinations recorded strong growth during July.
Among the top destinations by change in export value, exports to Singapore rose 83.7%, while exports to China increased 64.57%.
Exports to Kenya grew 151.41%, while Malaysia recorded 73.03% growth.
Exports to the United States increased 12.85% during July compared with the same month last year.
For April-July 2026-27, Singapore recorded 97.11% growth in exports from India. Exports to Tanzania increased 131.2%, while those to Sri Lanka rose 111.76%.
Exports to South Africa grew 69.75%, while exports to China increased 35.97%.
Imports Rise from Key Trading Partners
India also recorded higher imports from several major trading partners.
During July, imports from Oman increased 150.36%, while imports from Taiwan rose 111.3%.
Imports from Russia increased 83.85%, followed by China at 34.42% and the United States at 18.11%.
During April-July 2026-27, imports from Oman recorded a 200.68% increase.
Imports from Brazil rose 166.84%, while those from Russia increased 59.65%. Imports from the United States and China grew 22.42% and 29.68%, respectively.
India’s export performance during the first four months of 2026-27 therefore shows strong growth across both merchandise and services. At the same time, the faster rise in imports has widened the overall trade deficit, making the balance between export expansion and import growth an important factor to watch in the coming months.
Subscribe Deshwale on YouTube
